The Tohoku Tsunami Project
2022
On 11 March 2011, at 05:46:24 UTC, a magnitude 9.0 Mw earthquake struck at 38.2978° N, 142.3738° E, at a depth of 29 km, near the east coast of Honshu, Japan (USGS 1971–). The earthquake triggered a tsunami with wave heights reaching up to 38.9 m, which caused the majority of casualties and much of the physical destruction and loss. According to official reports, 15,821 people died, 3,962 were reported missing, and 5,940 were injured across 20 Japanese prefectures. This was the most powerful earthquake ever recorded in Japan and the fourth largest in the world. It was also the first time in history that an earthquake or tsunami led to a nuclear accident. (Dunbar, McCullough, Mungov, Varner, and Stroker, 2011, pp. 305–306)
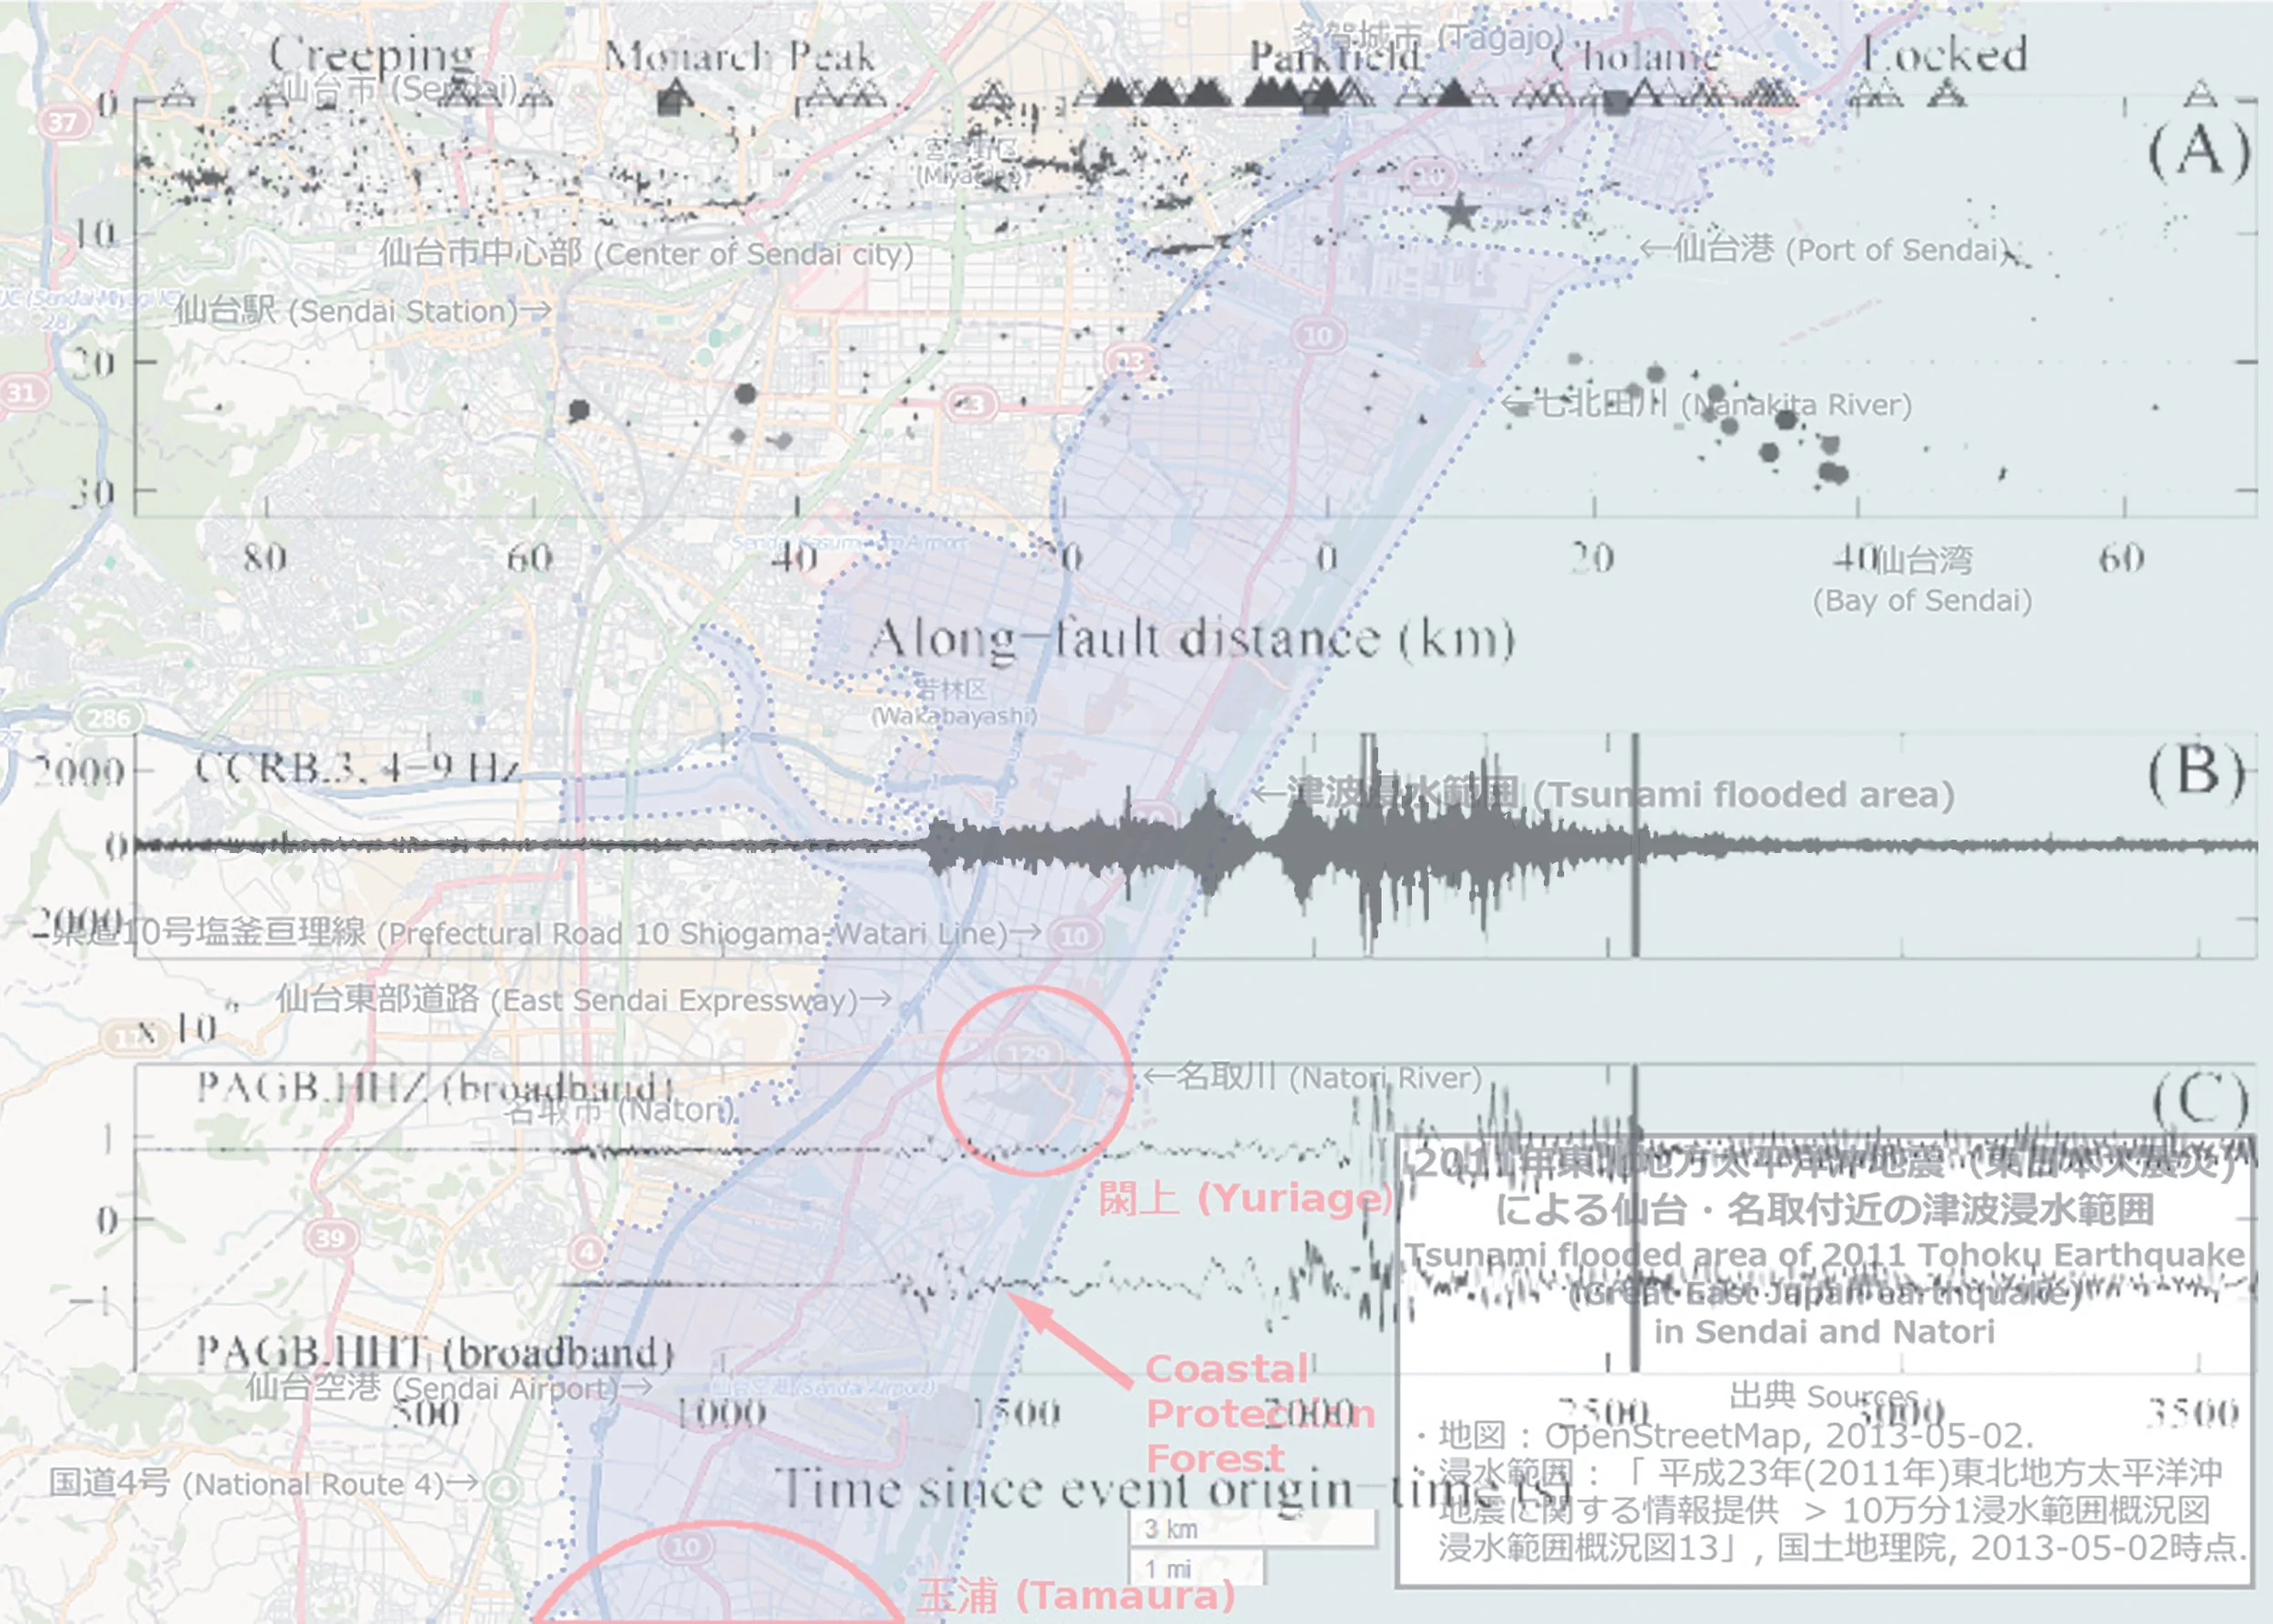
According to the EERI Special Earthquake Report, two international tsunami survey teams were dispatched to study tsunami deposits. They measured water levels, flow directions, topography, sediment thickness, grain size, and sedimentary structures, producing a large dataset that is now publicly available. Their findings made it clear that existing earthquake preparedness plans were inadequate. These data will be essential for improving readiness for future extreme events. The collected material also included scientific reports, maps, and Google Earth imagery showing before-and-after views of the affected regions.
In my installation, I present this collected information in three stages. First, Google Earth images serve as visual evidence of the disaster. The second stage displays reports, figures, maps, and datasets gathered and analyzed by scientific experts. Finally, the third stage features a series of my own drawings, created after studying these reports. Using the narrative quality of drawing, I translated the scientific findings into my own visual language. Shapes, lines, and colors are interwoven with scientific diagrams and elements. These drawings offer a parallel interpretation—one that follows a different path from the survey teams—by reframing the research through an artistic lens.
References:
Dunbar, P., McCullough, H., Mungov, G., Varner, J., & Stroker, K. (2011). 2011 Tohoku earthquake and tsunami data available from the national oceanic and atmospheric administration/national geophysical data center. Geomatics, Natural Hazards, and Risk, 2(4), 305-323.

The Tōhoku Tsunami Project. Untitled. Drawing on Paper. 2022.
The Tōhoku Tsunami Project. Untitled. Digital Print on Paper. 2022.

The Tōhoku Tsunami Project. Untitled. Drawing on Digital Print on Paper. 2022.
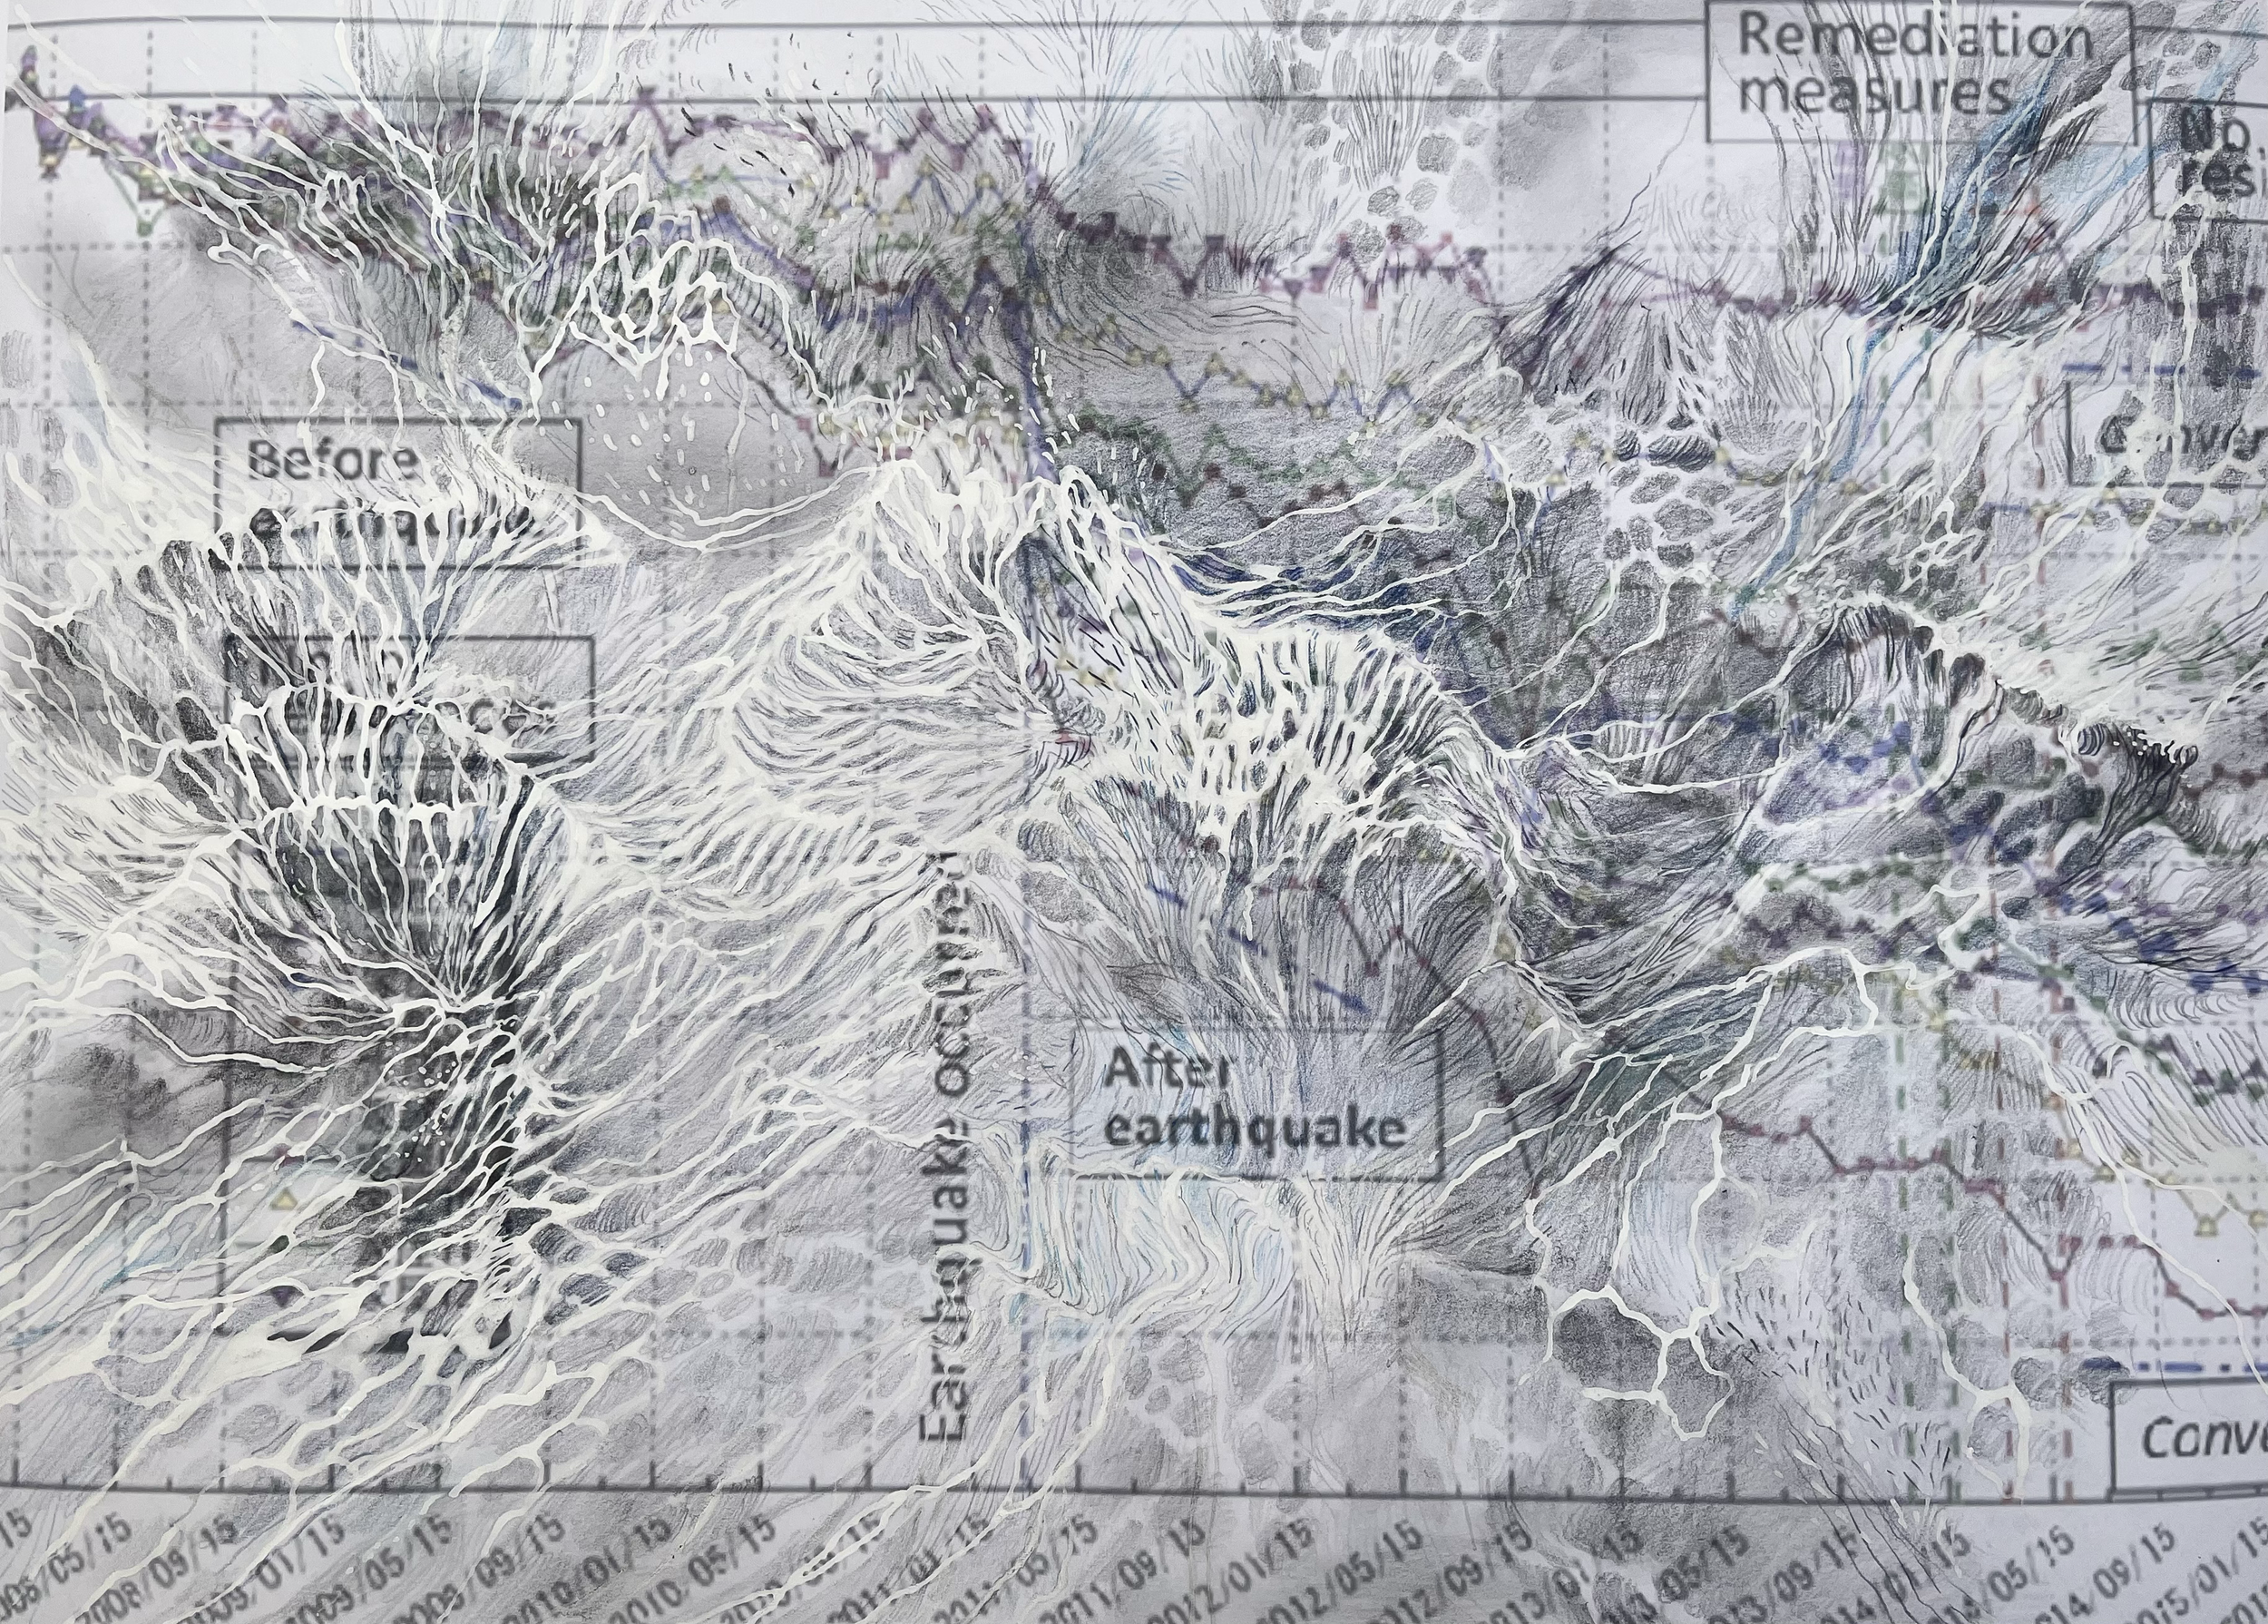
The Tōhoku Tsunami Project. Untitled. Drawing on Digital Print on Paper. 2022.

The Tōhoku Tsunami Project. Untitled. Drawing on Digital Print on Paper. 2022.
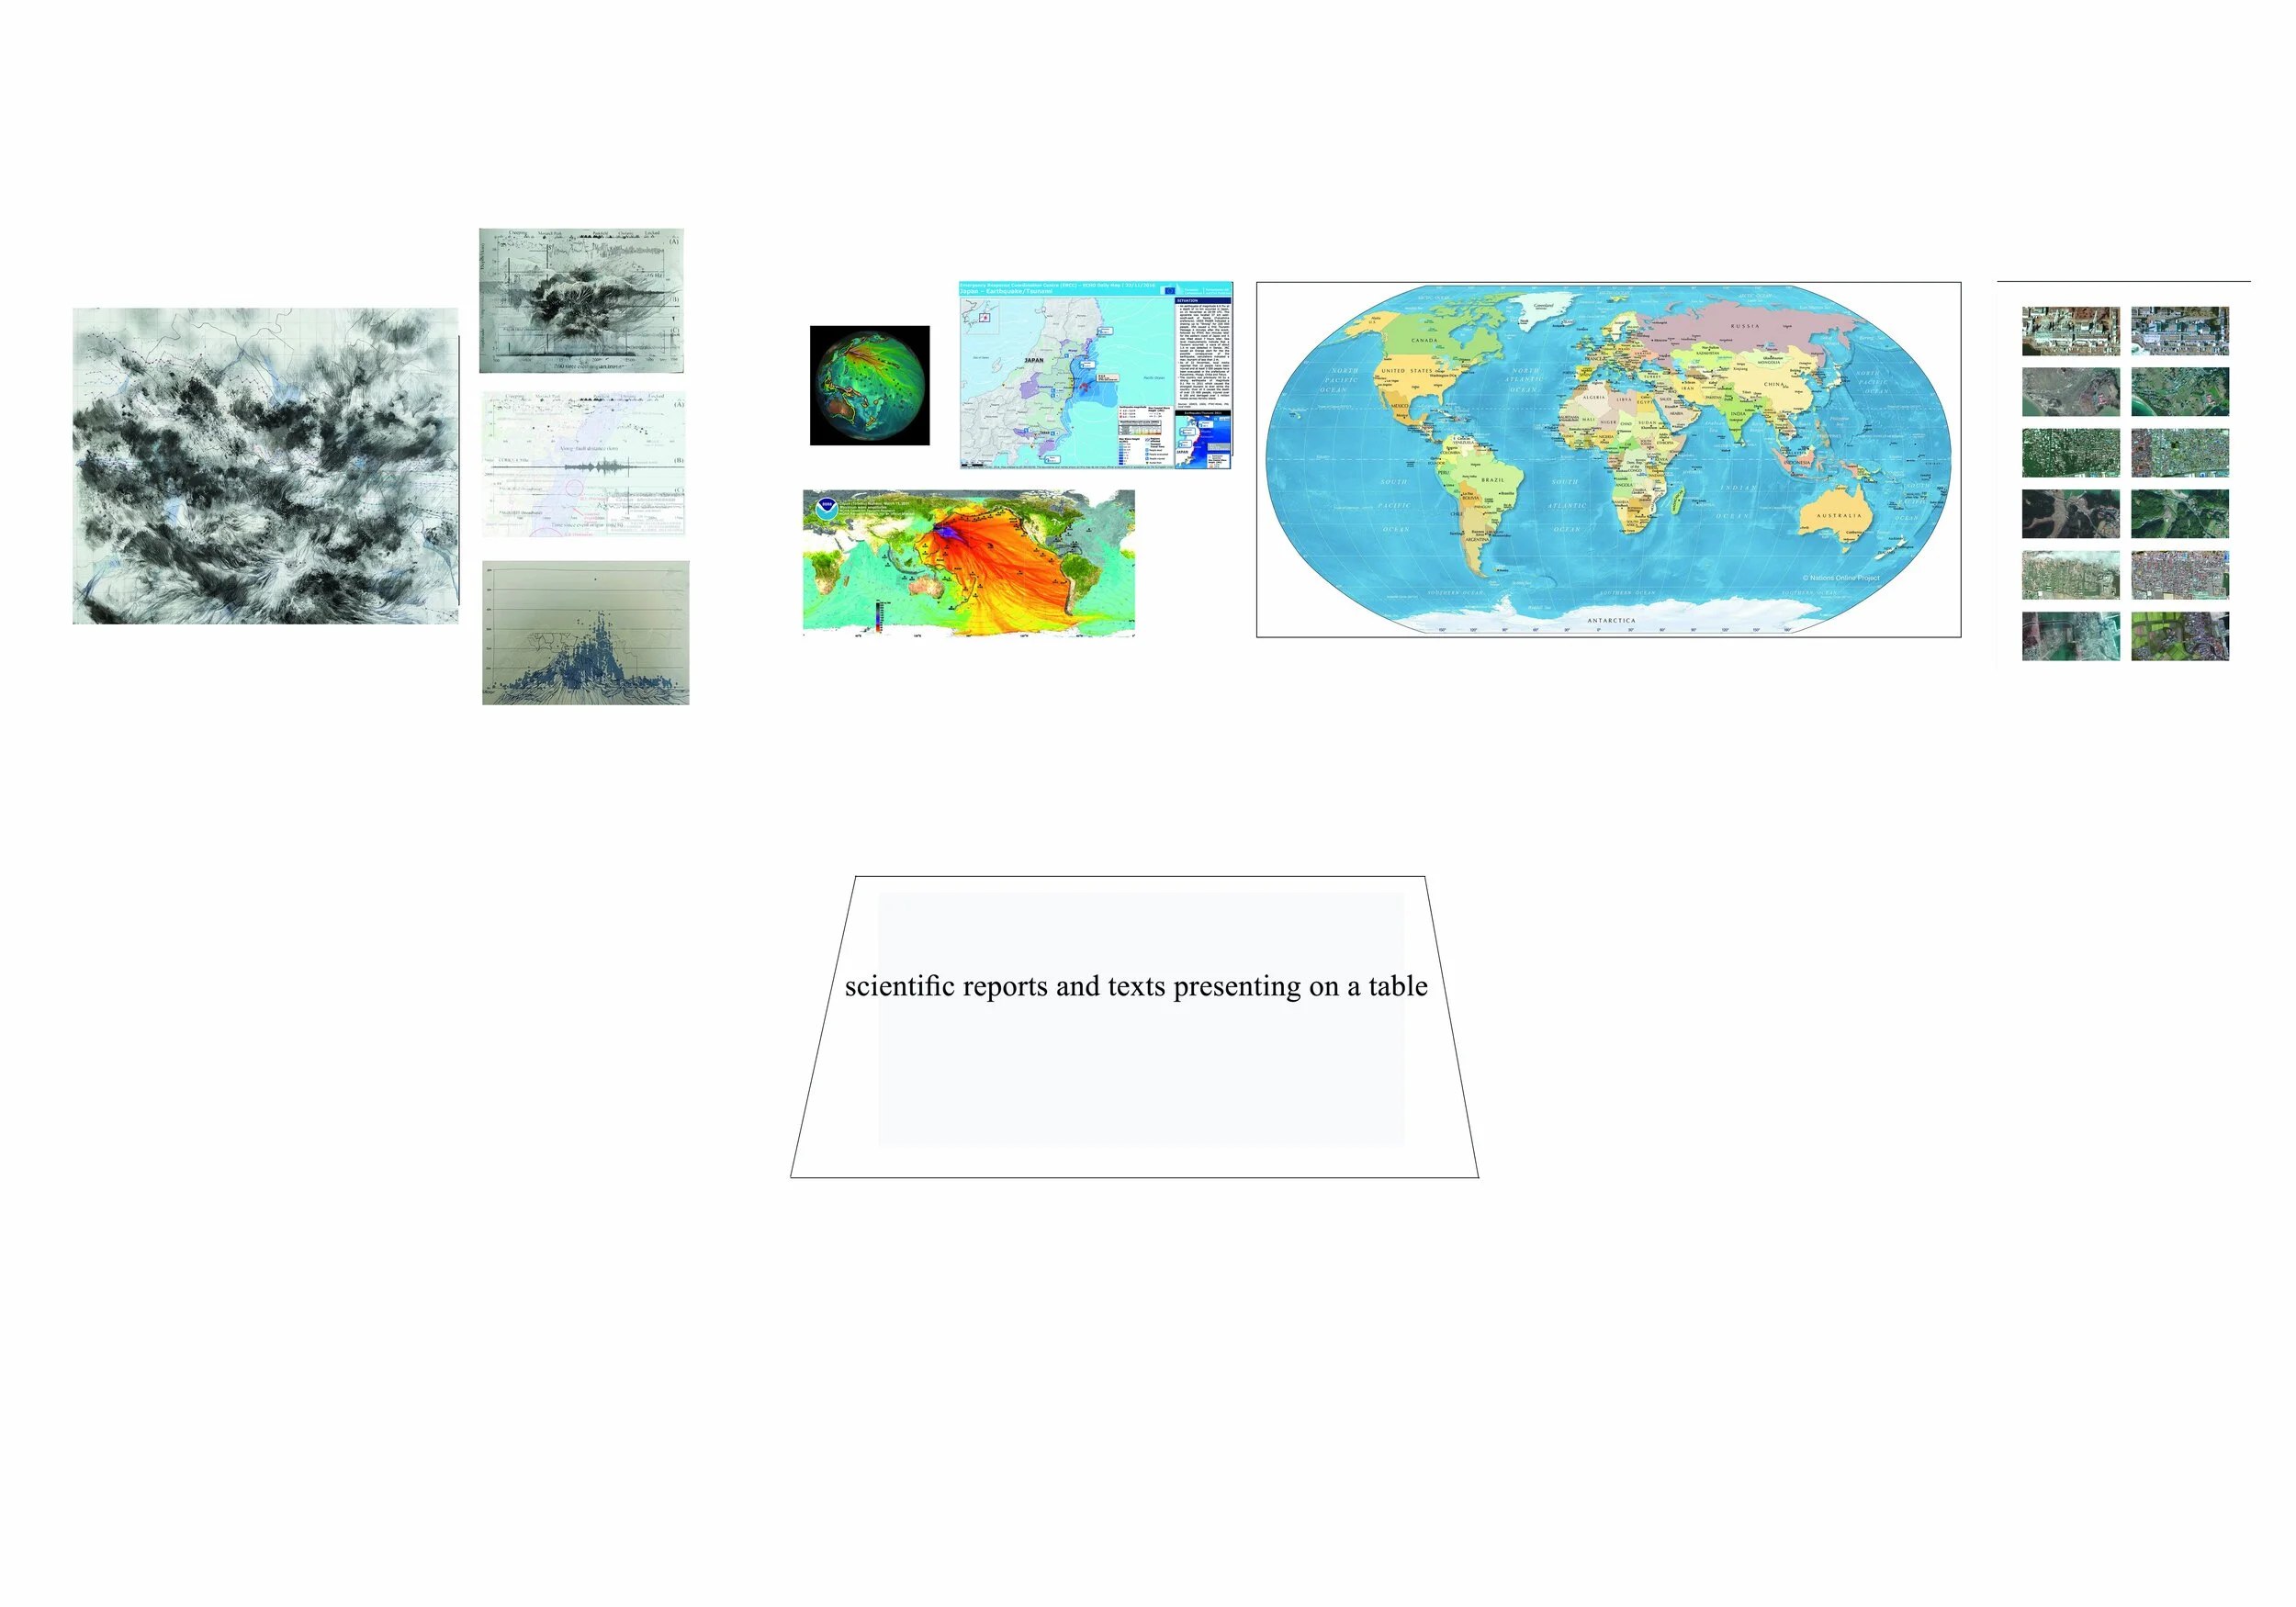
The Tōhoku Tsunami Project. Installation proposed for an exhibition. 2022.